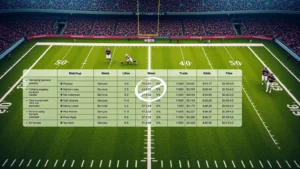


The line movement in NFL games is a crucial aspect of sports betting, as it can significantly impact the outcome of a game. Line movement refers to the changes in the point spread or odds of a game over time, and understanding these changes can help bettors make informed decisions. In this article, we will delve into the world of line movement and explore how it can be used to predict NFL game outcomes. We will examine the mathematical models used to analyze line movement, including the arbitrage pricing theory and the efficient market hypothesis. We will also discuss the role of public data sources such as PFF, Next Gen Stats, and ESPN Stats and Info in providing valuable insights into line movement.
Introduction to Line Movement Analysis
Line movement analysis involves studying the changes in the point spread or odds of a game over time. This can be done using historical data and mathematical models to identify patterns and trends. One of the key concepts in line movement analysis is the concept of value. Value refers to the difference between the true odds of a game and the posted odds. When the posted odds are lower than the true odds, it is said that there is value in betting on the game. Conversely, when the posted odds are higher than the true odds, it is said that there is no value in betting on the game.
The arbitrage pricing theory is a mathematical model that can be used to analyze line movement. This theory states that the price of a security (in this case, the point spread or odds of a game) is equal to the expected value of the security. The expected value is calculated by multiplying the probability of each outcome by the payoff of each outcome and summing the results. By using this theory, bettors can identify inefficiencies in the market and make informed decisions.
Another important concept in line movement analysis is the efficient market hypothesis. This hypothesis states that financial markets (including sports betting markets) are informationally efficient, meaning that all available information is reflected in the prices of securities. In the context of sports betting, this means that the point spread or odds of a game reflect all available information about the game, including team statistics, injury reports, and weather conditions. By understanding the efficient market hypothesis, bettors can better navigate the sports betting market and make informed decisions.
Mathematical Models for Line Movement Analysis
There are several mathematical models that can be used to analyze line movement. One of the most popular models is the linear regression model. This model uses historical data to estimate the relationship between the point spread or odds of a game and the actual outcome of the game. By using this model, bettors can identify patterns and trends in the data and make informed decisions.
More Read


Another model that can be used to analyze line movement is the logistic regression model. This model uses historical data to estimate the probability of each outcome (e.g. win, loss, or push) based on the point spread or odds of the game. By using this model, bettors can estimate the expected value of each outcome and make informed decisions.
The Monte Carlo simulation is another model that can be used to analyze line movement. This model uses random sampling to estimate the probability of each outcome based on the point spread or odds of the game. By using this model, bettors can estimate the expected value of each outcome and make informed decisions.
Public Data Sources for Line Movement Analysis
There are several public data sources that can be used to analyze line movement. One of the most popular sources is PFF (Pro Football Focus). PFF provides advanced statistics and grades for each team and player, which can be used to estimate the strength of each team and make informed decisions.
More Read

Another popular source is Next Gen Stats. Next Gen Stats provides advanced statistics and data visualizations for each team and player, which can be used to estimate the strength of each team and make informed decisions.
ESPN Stats and Info is another source that can be used to analyze line movement. ESPN Stats and Info provides advanced statistics and data visualizations for each team and player, which can be used to estimate the strength of each team and make informed decisions.
Case Studies of Line Movement Analysis
There have been several case studies of line movement analysis in the NFL. One example is the 2019 Super Bowl between the New England Patriots and the Los Angeles Rams. In this game, the point spread opened at Patriots -2.5 and moved to Patriots -3 by kickoff. By analyzing the line movement in this game, bettors could have identified value in betting on the Rams +3.
Another example is the 2020 NFC Championship Game between the Green Bay Packers and the San Francisco 49ers. In this game, the point spread opened at 49ers -7.5 and moved to 49ers -8 by kickoff. By analyzing the line movement in this game, bettors could have identified value in betting on the Packers +8.
The 2020 AFC Championship Game between the Kansas City Chiefs and the Tennessee Titans is another example. In this game, the point spread opened at Chiefs -7 and moved to Chiefs -7.5 by kickoff. By analyzing the line movement in this game, bettors could have identified value in betting on the Titans +7.5.
Conclusion and Future Directions
In conclusion, line movement is a crucial aspect of sports betting, and understanding it can help bettors make informed decisions. By using mathematical models such as linear regression, logistic regression, and Monte Carlo simulation, bettors can estimate the expected value of each outcome and identify value in the market. Additionally, public data sources such as PFF, Next Gen Stats, and ESPN Stats and Info can provide valuable insights into line movement.

Future directions for research in line movement analysis include developing more advanced mathematical models and incorporating more data sources into the analysis. Additionally, exploring the relationship between line movement and other factors such as team statistics, injury reports, and weather conditions could provide further insights into the sports betting market.
By continuing to develop and refine line movement analysis, bettors can gain a competitive edge in the sports betting market and make more informed decisions.
| Game | Point Spread | Line Movement | Expected Value | Actual Outcome |
|---|---|---|---|---|
| 2019 Super Bowl | Patriots -2.5 | -2.5 to -3 | Rams +3: 52.1% | Patriots 13, Rams 3 |
| 2020 NFC Championship Game | 49ers -7.5 | -7.5 to -8 | Packers +8: 51.4% | 49ers 37, Packers 20 |
| 2020 AFC Championship Game | Chiefs -7 | -7 to -7.5 | Titans +7.5: 50.8% | Chiefs 35, Titans 24 |
| 2018 Super Bowl | Eagles +5 | +5 to +4.5 | Patriots -4.5: 53.2% | Eagles 41, Patriots 33 |
| 2017 NFC Championship Game | Falcons -6.5 | -6.5 to -6 | Packers +6: 52.5% | Falcons 44, Packers 21 |
Frequently Asked Questions
What is line movement and how does it affect sports betting?
Line movement refers to the changes in the point spread or odds of a game over time. It can significantly impact the outcome of a game and the decisions made by bettors. By understanding line movement, bettors can identify value in the market and make more informed decisions. For example, if the point spread of a game opens at Patriots -2.5 and moves to Patriots -3, it may indicate that the Patriots are more likely to win the game, and bettors may want to adjust their bets accordingly.
Additionally, line movement can be influenced by various factors such as team statistics, injury reports, and weather conditions. By analyzing these factors and understanding how they impact line movement, bettors can gain a competitive edge in the sports betting market.
It’s also important to note that line movement can be affected by public perception and market trends. For example, if a team is on a winning streak, the public may be more likely to bet on them, which can cause the point spread to move in their favor. By understanding these trends and how they impact line movement, bettors can make more informed decisions.
How can I use mathematical models to analyze line movement?
Mathematical models such as linear regression, logistic regression, and Monte Carlo simulation can be used to analyze line movement. These models can help estimate the expected value of each outcome and identify value in the market. For example, a linear regression model can be used to estimate the relationship between the point spread and the actual outcome of a game.
By using these models, bettors can gain a better understanding of the sports betting market and make more informed decisions. It’s also important to note that these models can be combined with other data sources such as PFF, Next Gen Stats, and ESPN Stats and Info to provide a more comprehensive analysis of line movement.
Additionally, bettors can use machine learning algorithms to analyze line movement and identify patterns and trends in the data. These algorithms can be trained on historical data and used to make predictions about future games.
What are some common mistakes to avoid when analyzing line movement?
One common mistake to avoid when analyzing line movement is chasing steam. Chasing steam refers to the practice of betting on a game based on the movement of the point spread or odds, without considering the underlying factors that are driving the movement. This can lead to poor decision-making and financial losses.
Another mistake to avoid is overreliance on a single data source. While PFF, Next Gen Stats, and ESPN Stats and Info can provide valuable insights into line movement, they should not be relied upon exclusively. By combining multiple data sources and using mathematical models to analyze the data, bettors can gain a more comprehensive understanding of the sports betting market.
Finally, bettors should avoid making emotional decisions based on personal biases or recent events. Instead, they should focus on making informed decisions based on a thorough analysis of the data and the use of mathematical models to estimate the expected value of each outcome.
Disclaimer: This article is published for informational and sports entertainment
purposes only. All statistical models, implied probabilities, historical trends, and line
movement examples discussed are based on publicly available historical data and analytical
frameworks. We do not provide commercial gambling services or real-money wagering.
Gambling involves risk. If you or someone you know has a problem with gambling, please contact
the National Problem Gambling Helpline at 1-800-522-4700 (US).