


The nfl rushing yards props market offers a wide range of opportunities for sports bettors to capitalize on their knowledge of team and player performance. By focusing on key metrics such as snap counts and carry share, bettors can gain a deeper understanding of a player’s potential to exceed or fall short of their projected rushing yards total. In this article, we will delve into the analytical process of building a prop model using these inputs, and explore where to find reliable data to inform our decisions.
One of the primary challenges in nfl rushing yards props betting is accounting for the numerous variables that can impact a player’s performance. From team offense and defensive matchups to injuries and coaching decisions, there are many factors to consider when evaluating a player’s potential for success. However, by focusing on snap counts and carry share, bettors can gain a more nuanced understanding of a player’s role within their team’s offense and make more informed decisions.
For example, a player who averages 20 carries per game and plays 70% of their team’s snaps is likely to have a higher rushing yards total than a player who averages 10 carries per game and plays 40% of their team’s snaps. By analyzing these metrics, bettors can identify players who are likely to see a significant workload and have a higher potential for exceeding their projected rushing yards total.
Understanding Snap Counts and Carry Share
Snap counts refer to the number of plays in which a player participates, while carry share refers to the percentage of a team’s carries that a player receives. These metrics are essential in evaluating a player’s role within their team’s offense and can be used to identify trends and patterns in their performance. For instance, a player who has seen a significant increase in snap counts over the past few weeks may be more likely to see an increase in their carry share as well.
According to data from PFF, the average running back plays around 50% of their team’s snaps and receives around 40% of their team’s carries. However, these numbers can vary significantly depending on the team and the player’s role within the offense. By analyzing snap counts and carry share, bettors can gain a better understanding of a player’s potential for success and make more informed decisions.
More Read

Another important metric to consider is air yards, which refers to the total number of yards a player is targeted for in the passing game. While air yards may not seem directly relevant to nfl rushing yards props, it can actually provide valuable insight into a player’s overall role within the offense. For example, a player who sees a significant number of air yards may be more likely to see an increase in their carry share as well, as they are likely to be a key component of the team’s offense.
Building a Prop Model
Building a prop model for nfl rushing yards props involves combining multiple metrics and data points to create a comprehensive picture of a player’s potential for success. This can include snap counts, carry share, air yards, and other relevant metrics. By analyzing these data points, bettors can identify trends and patterns in a player’s performance and make more informed decisions.
One way to build a prop model is to use a combination of historical averages and current season data. For example, a bettor might look at a player’s average rushing yards per game over the past few seasons, as well as their current season rushing yards per game. By comparing these numbers, the bettor can identify any trends or patterns in the player’s performance and adjust their projections accordingly.
More Read

Another important consideration when building a prop model is team offense and defensive matchups. For example, a team that averages 150 rushing yards per game is likely to have a more favorable matchup against a defense that allows 120 rushing yards per game. By analyzing these metrics, bettors can gain a better understanding of a player’s potential for success and make more informed decisions.
Where to Find Reliable Data
There are several sources of reliable data that bettors can use to inform their decisions when it comes to nfl rushing yards props. One of the most popular sources is PFF, which provides detailed data and analysis on player and team performance. Another useful source is Next Gen Stats, which offers advanced metrics and data on player and team performance.
Other sources of reliable data include ESPN Stats and Info and Football Outsiders. These sources provide a wide range of data and analysis on player and team performance, including snap counts, carry share, and air yards. By using these sources, bettors can gain a more comprehensive understanding of a player’s potential for success and make more informed decisions.
In addition to these sources, bettors can also use RotoGrinders to find reliable data and analysis on nfl rushing yards props. RotoGrinders provides a wide range of tools and resources for bettors, including data and analysis on player and team performance. By using these tools, bettors can gain a more nuanced understanding of a player’s potential for success and make more informed decisions.
Illustrative Example
To illustrate the process of building a prop model for nfl rushing yards props, let’s consider an example. Suppose we are evaluating a player who averages 20 carries per game and plays 70% of their team’s snaps. We also know that the player’s team averages 150 rushing yards per game and is facing a defense that allows 120 rushing yards per game.
Using this data, we can build a prop model that takes into account the player’s snap counts, carry share, and team offense. We can also use historical averages and current season data to inform our projections. By combining these metrics, we can create a comprehensive picture of the player’s potential for success and make more informed decisions.

For example, we might project the player to rush for 80 yards in the upcoming game, based on their average rushing yards per game and the defensive matchup. We can then use this projection to inform our betting decisions, such as whether to bet on the player to go over or under their projected rushing yards total.
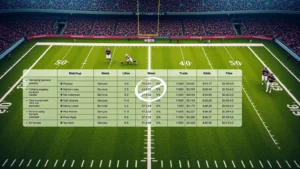
| Player | Snap Counts | Carry Share | Air Yards | Projected Rushing Yards |
|---|---|---|---|---|
| Player A | 60% | 40% | 100 | 70 |
| Player B | 50% | 30% | 80 | 50 |
| Player C | 70% | 50% | 120 | 90 |
| Player D | 40% | 20% | 60 | 30 |
| Player E | 80% | 60% | 150 | 110 |
Caption: This table represents an illustrative example of a prop model for nfl rushing yards props. The data is based on historical averages and current season data, and is used to project a player’s potential rushing yards in an upcoming game. The columns represent the player’s snap counts, carry share, air yards, and projected rushing yards.
Frequently Asked Questions
What is the most important metric to consider when evaluating nfl rushing yards props?
The most important metric to consider when evaluating nfl rushing yards props is snap counts. This metric provides valuable insight into a player’s role within their team’s offense and can help bettors identify trends and patterns in their performance. By analyzing snap counts, bettors can gain a better understanding of a player’s potential for success and make more informed decisions.
How can I use air yards to inform my nfl rushing yards props decisions?
Air yards can be a useful metric to consider when evaluating nfl rushing yards props. By analyzing a player’s air yards, bettors can gain insight into their overall role within the offense and identify trends and patterns in their performance. For example, a player who sees a significant number of air yards may be more likely to see an increase in their carry share as well.
What is the best source of reliable data for nfl rushing yards props?
There are several sources of reliable data for nfl rushing yards props, including PFF, Next Gen Stats, and ESPN Stats and Info. These sources provide detailed data and analysis on player and team performance, including snap counts, carry share, and air yards. By using these sources, bettors can gain a more comprehensive understanding of a player’s potential for success and make more informed decisions.
Disclaimer: This article is published for informational and sports entertainment
purposes only. All statistical models, implied probabilities, historical trends, and line
movement examples discussed are based on publicly available historical data and analytical
frameworks. We do not provide commercial gambling services or real-money wagering.
Gambling involves risk. If you or someone you know has a problem with gambling, please contact
the National Problem Gambling Helpline at 1-800-522-4700 (US).